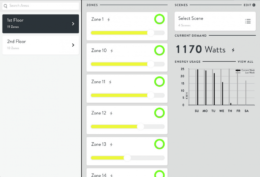
The Energy view gives you a complete look at the energy consumption of your Site and its Areas, allowing you to quickly discover patterns of usage and potential for energy savings. Energy is organized by Area.

Zone Details: To view the energy usage for a specific Zone, select the Zone’s Area, then Scroll to the Zone under Energy by Zone. Devices that do not have Power Monitoring enabled will show an exclamation-mark icon, as they will not be able to collect usage data. Click the arrow next to any Zone to display its On/Off and Dim Level history for that Zone. The graph on the bottom allows you to zoom in and out, down to the minute.

Energy Reports: downloaded from the bottom of the Zone list.
- Usage CSV: Usage data in CSV format.
- Monthly Energy Report: Provides a comprehensive overview of energy usage in PDF format.
- 15 Minute Energy Report (must be enabled): Provides extra-detailed 15-minute power history in CSV format.